
Introduction
This article introduces you to the details shown in the Payment report. The Reports are depicted in graphical form. The Payment Report shows the Revenue, Outstanding Bills, Wallet Revenue, Credit Card Revenue, Refund, Cancel Invoice, and Void graph depicting the trends in a comparative way.
To view the Payment Report, go to the Reports from the left menu of the Flavor System and then click on the Payment tab.
Revenue Report
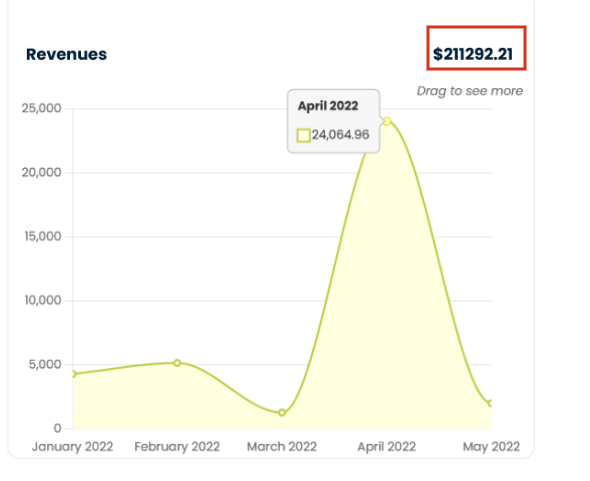
The Revenue Box shows the Total revenue amount for the current year. The graph can be dragged to see through the other months.
- The Y-Axis Show the Revenue Numbers, While X-Axis shows the Month.
- When you hover over a month on the graph you will get exact data on how much revenue came in that month.
- When you click on the month, a new tab with a tabular revenue report will open.
Revenue Report Details
When clicked on the month on the graph, a new tab with Revenue report details in tabular form will open.
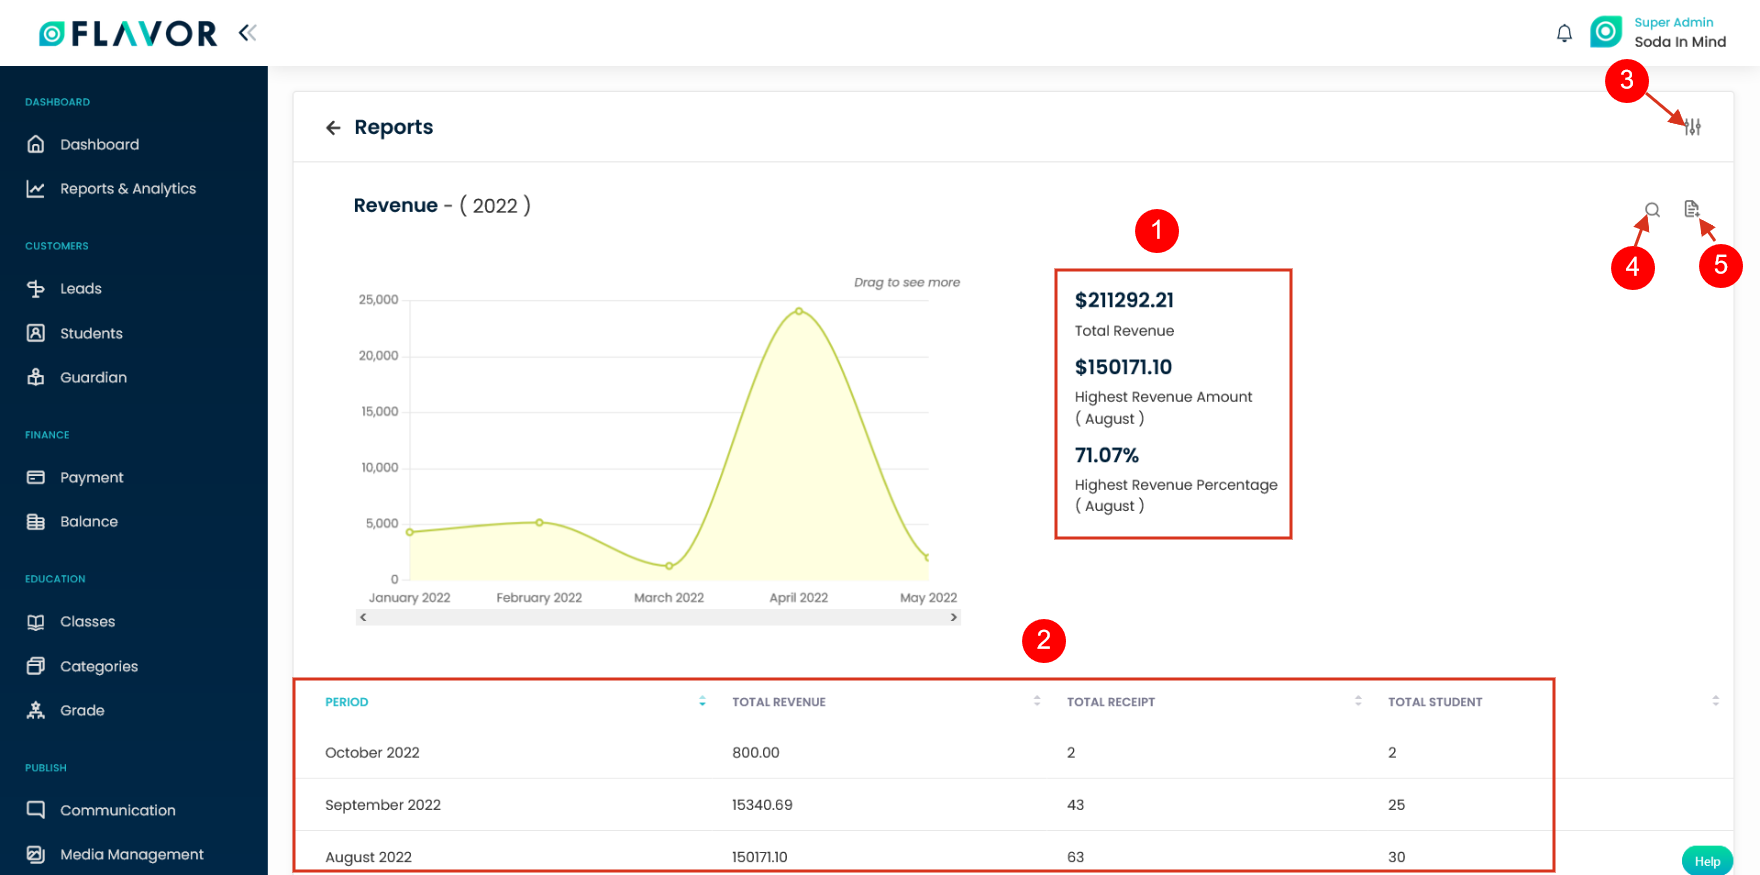
- Here the Total Revenue, Highest Revenue Amount and month, and Highest Revenue Percentage are shown.
- This part shows the revenue in tabular format. Period columns show you the month. Total Revenue shows revenue collected in the month, Total receipts shows how many receipts were generated in the month, and Total Student shows the number of students’ revenue received from that month
- Filter: It allows you to filter the records based on the Subsidiary, Branch, and Date span. Date span has two options viz. This Year and Custom Date.
- Search: You need to enter the period viz month or year and press enter. The searched results will be displayed in the table.
- Export: This option allows you to export the Revenue report in excel or CSV format to the specified email id.
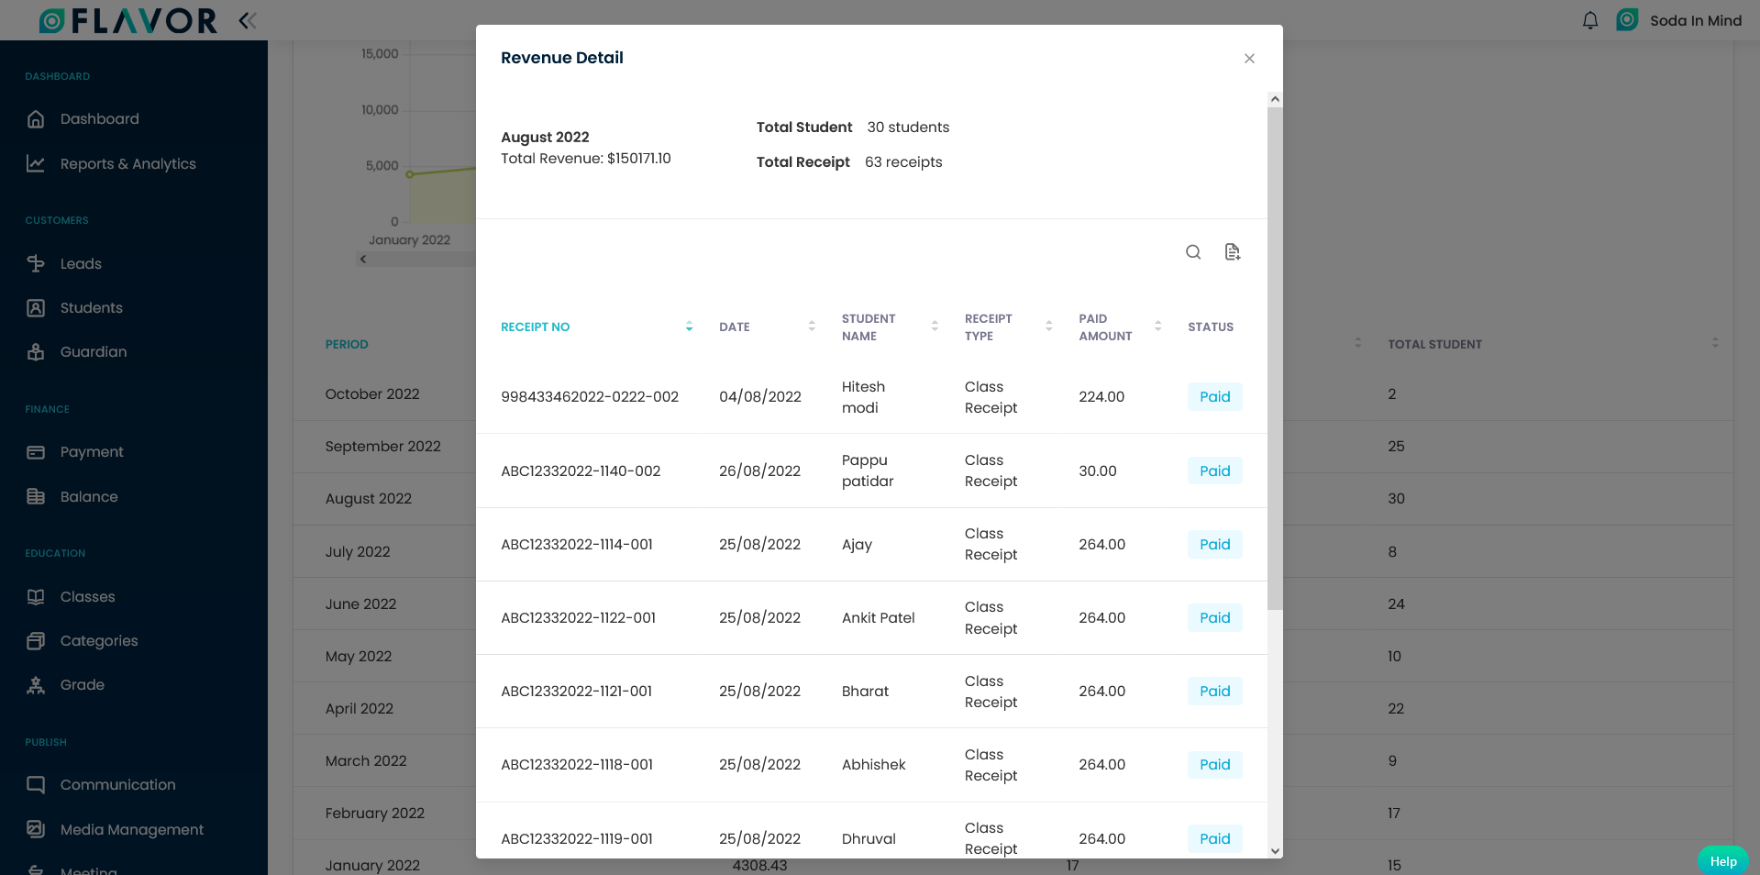
When clicking on each record in the table, a popup named Revenue Detail will appear on the screen.
Revenue Detail popup will show you the revenue details for that particular month, viz. the list of students with their Receipt Number, Payment date, Receipt Type, Paid amount, and Payment status. The records can be searched and exported too.
Outstanding Bills Report
The Outstanding Bills Box shows the total unpaid for invoices that have reached their due date for the current year. The chart can be dragged to see through the other months.
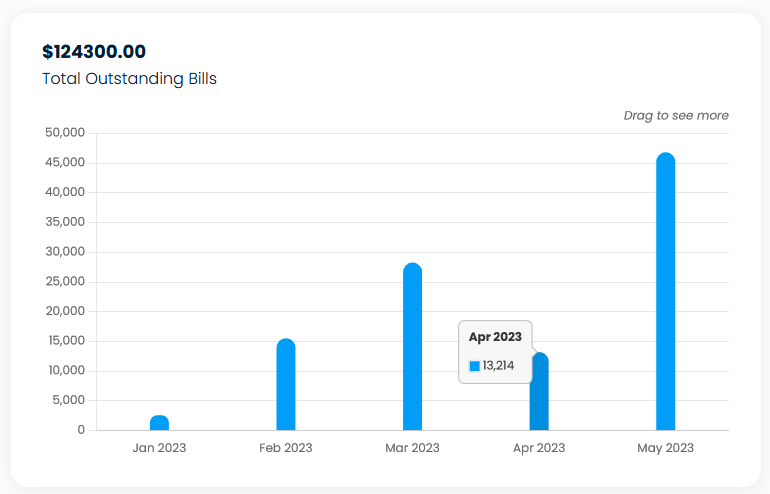
- The Y-axis shows the amount in Numbers.
- The X-Axis shows the month.
- The Bar when hovered on shows the value of outstanding bills and when clicked on will redirect to the Detailed Reports.
Outstanding Bill Reports Details
When clicked on the bar, a new tab with Outstanding Bill report details in tabular format will open.
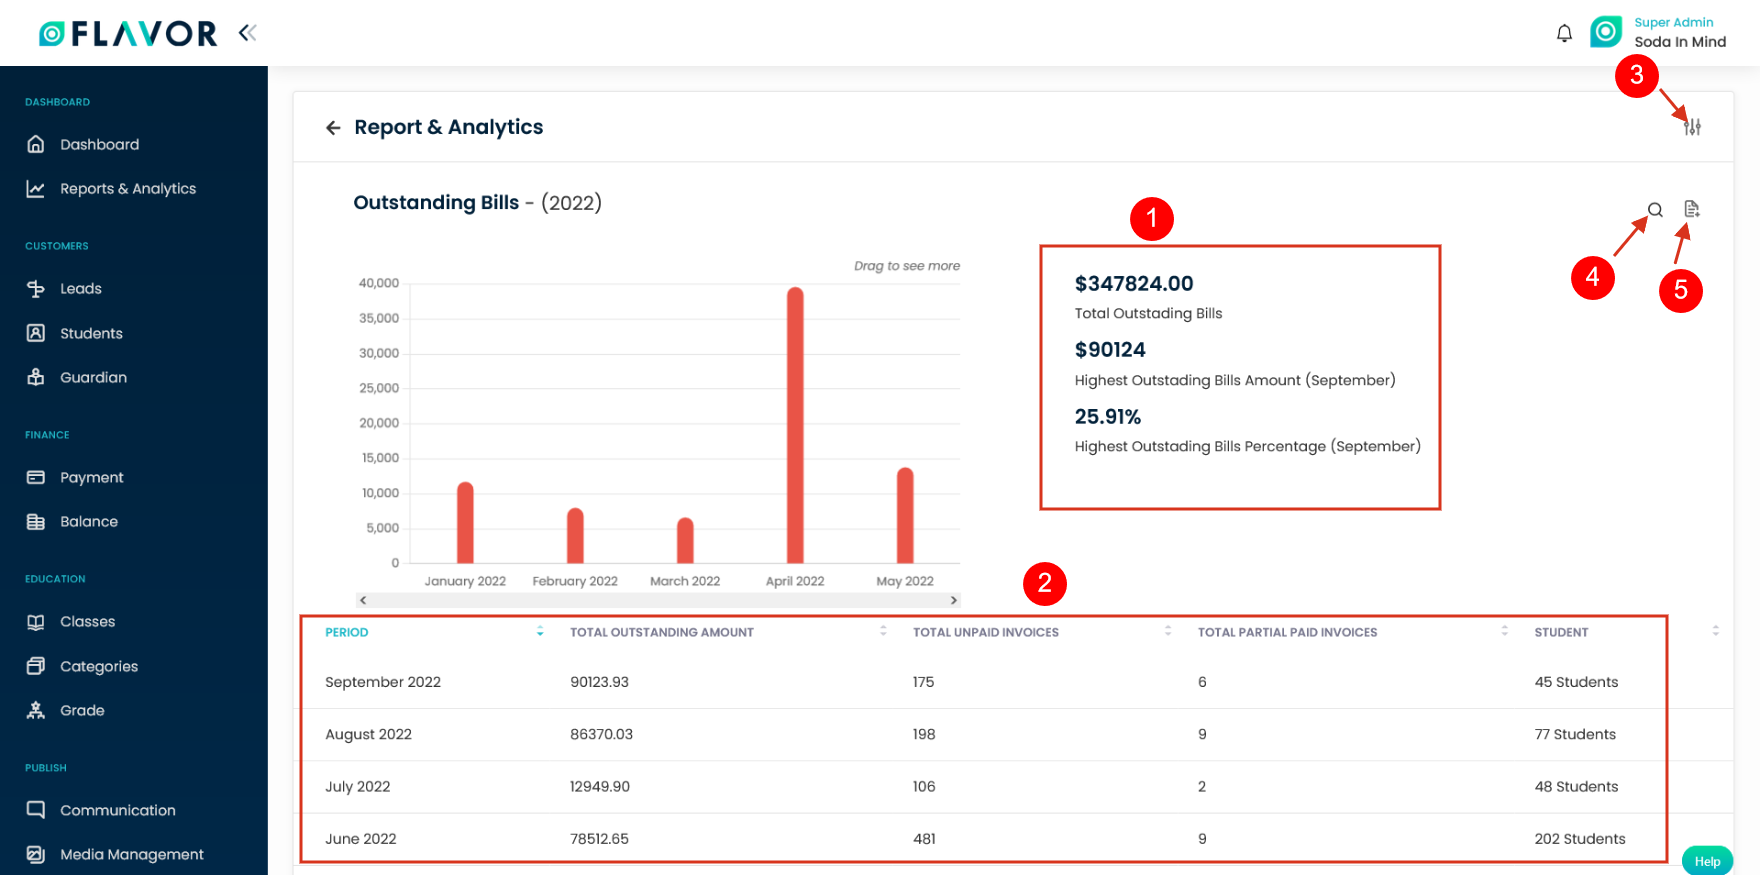
- Here the Total Outstanding Bills, Highest Outstanding Bills Amount and month, and Highest Outstanding Bills Percentage are shown.
- This part shows the Outstanding Bills in tabular format. Period columns show you the month. Total Outstanding amount shows the unpaid amount for the invoices that have reached the due date in that month, Total Unpaid Invoices indicates the number of unpaid invoices that are past the due date, and Total Partially paid Invoices indicates the number of partially paid invoices that are past the due date, and Total Students shows the number of students who have gone through.
- Filter: It allows you to filter the records based on the Subsidiary, Branch, and Date span. Date span has two options viz. This Year and Custom Date.
- Search: You need to enter the period viz month or year and press enter. The searched results will be displayed in the table.
- Export: This option allows you to export the Outstanding Bill report in excel or CSV format to the specified email id.
When clicking on each record in the table, a popup named Outstanding Bill Details will appear on the screen.
Outstanding Bill Detail popup will show you the Outstanding Bill details for that particular month, viz. the list of students with their Invoice Number, Student Name, Invoice Type, Due Date, and Outstanding amount.
The records can be searched and exported too.
Wallet Revenue Report
The Wallet Revenue Box shows the Total wallet revenue amount for the current year. The graph can be dragged to see through the other months.
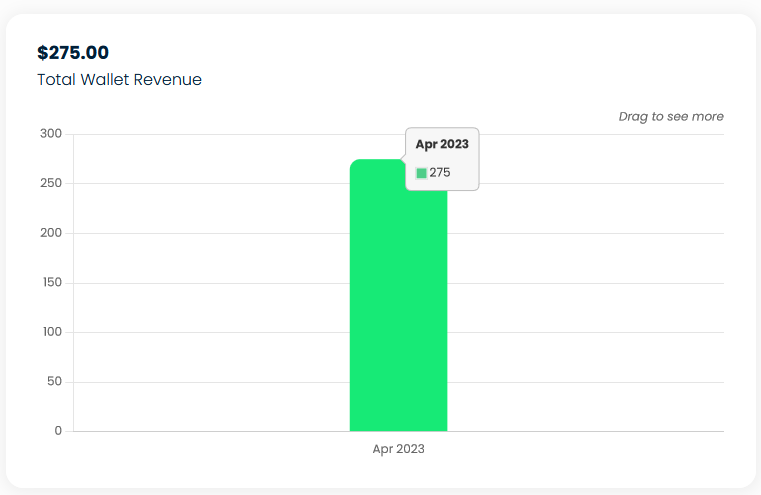
- The Y-Axis is for Revenue in SGD.
- The X-Axis is for months.
- When Hovered on a bar stick you get to exact wallet revenue.
- When clicked on, you will be redirected to the detailed report of that month’s performance.
Wallet Revenue Report Details
When clicked on the bar, a new tab with Wallet Revenue Details reports details in tabular format will open.
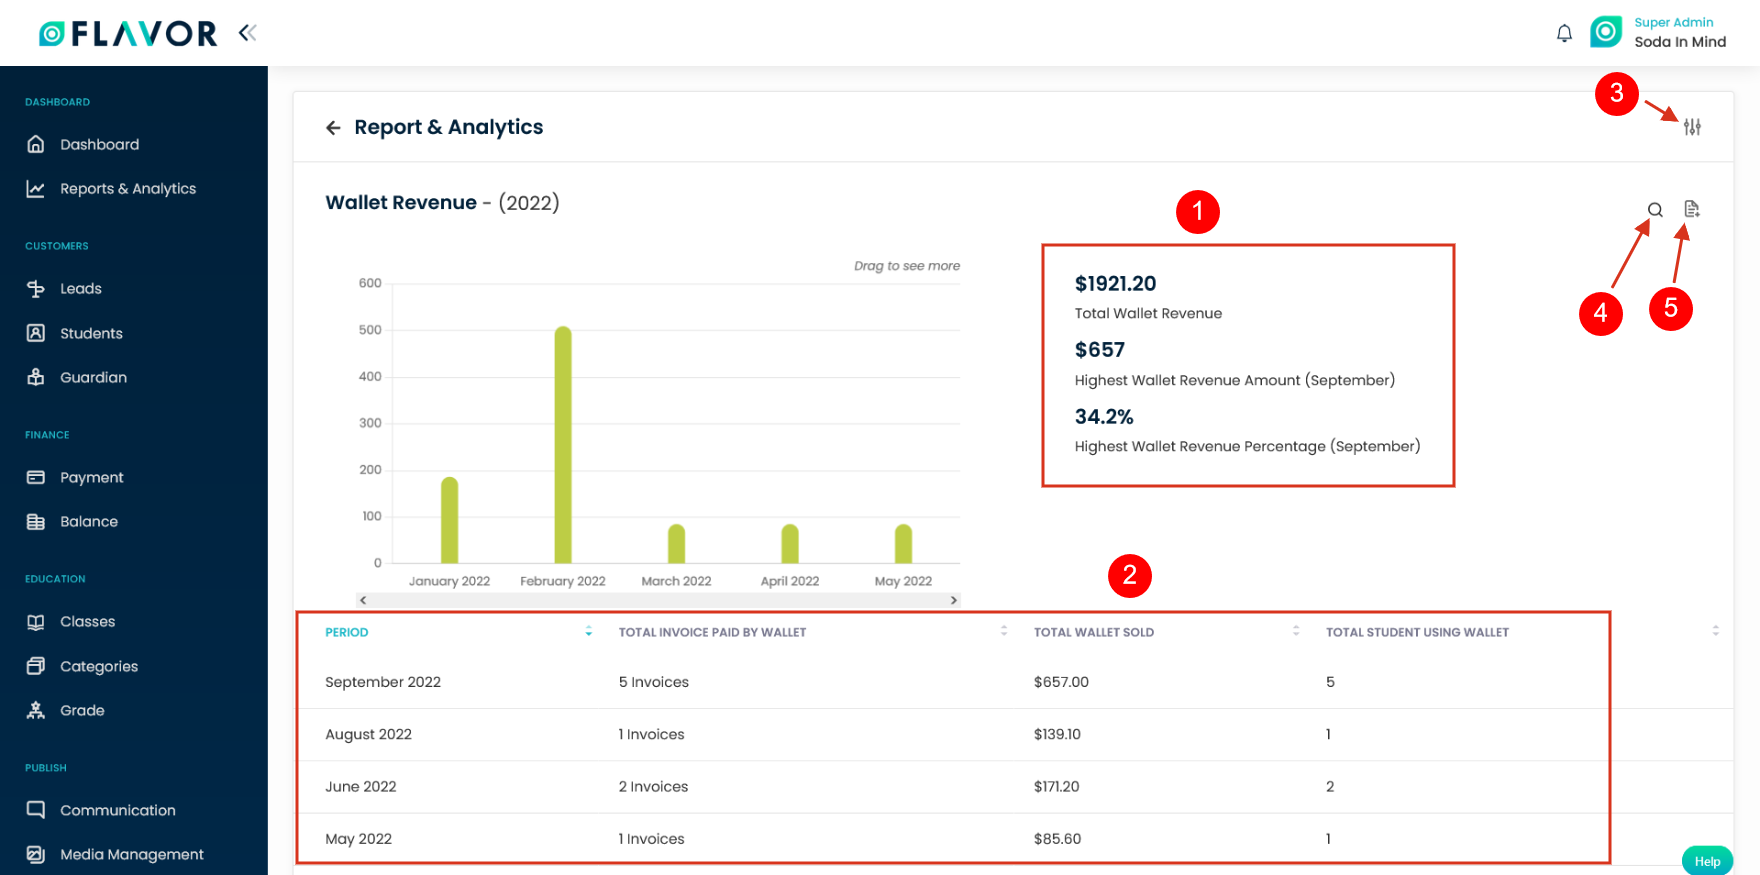
- Here the Total Wallet Balance, Highest Wallet Revenue Amount and month, and Highest Wallet Revenue Percentage are shown.
- This part shows the Wallet Revenue in tabular format. Period columns show you the month. Total Invoices paid by wallet show payment that has been offset with the wallet mechanism, Total wallet sold Invoices show the wallet amount that has been sold, and Total Student using wallet shows the number of students who have adopted paying by wallet mechanism of Flavor System.
- Filter: It allows you to filter the records based on the Subsidiary, Branch, and Date span. Date span has two options viz. This Year and Custom Date.
- Search: You need to enter the period viz month or year and press enter. The searched results will be displayed in the table.
- Export: This option allows you to export the Wallet Revenue report in excel or CSV format to the specified email id.
When clicking on each record in the table, a popup named Wallet Revenue Details will appear on the screen. Wallet Revenue Details popup shows two tabs viz. Invoice paid by wallet and Wallet sold.
Invoice paid by wallet:
Clicking on this Tab will show the invoice number, date, student name, invoice type, paid amount, and status.
Wallet sold:
Clicking on this Tab will show the date, Student name, Wallet amount, and Remarks. These records can be searched and exported too.
Class Credit Revenue Report
The Class Credit Revenue Box shows the Total Class Credit revenue amount for the current year. The graph can be dragged to see through the other months.
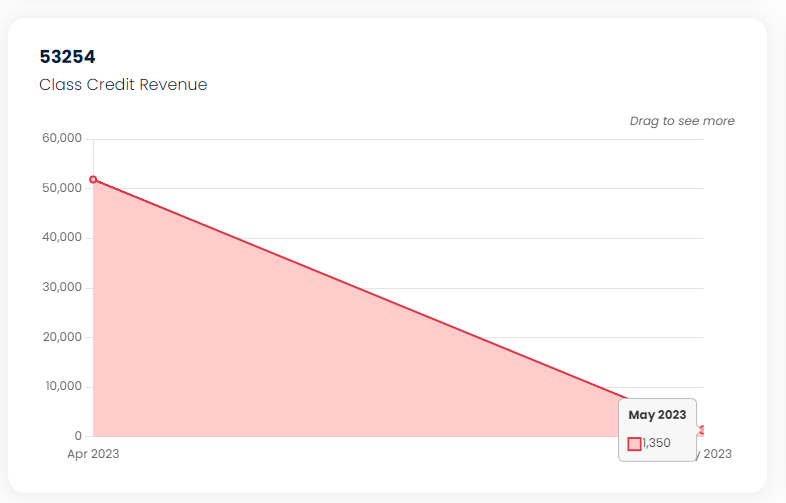
- The Y-Axis shows the amount in numbers.
- The X-Axis shows the months.
- You need to hover over a month to see the exact revenue number.
- When clicked on, you will be redirected to the detailed report.
Class Credit Revenue Details
When clicked on the bar, a new tab with Wallet Revenue Details reports details in tabular format will open.
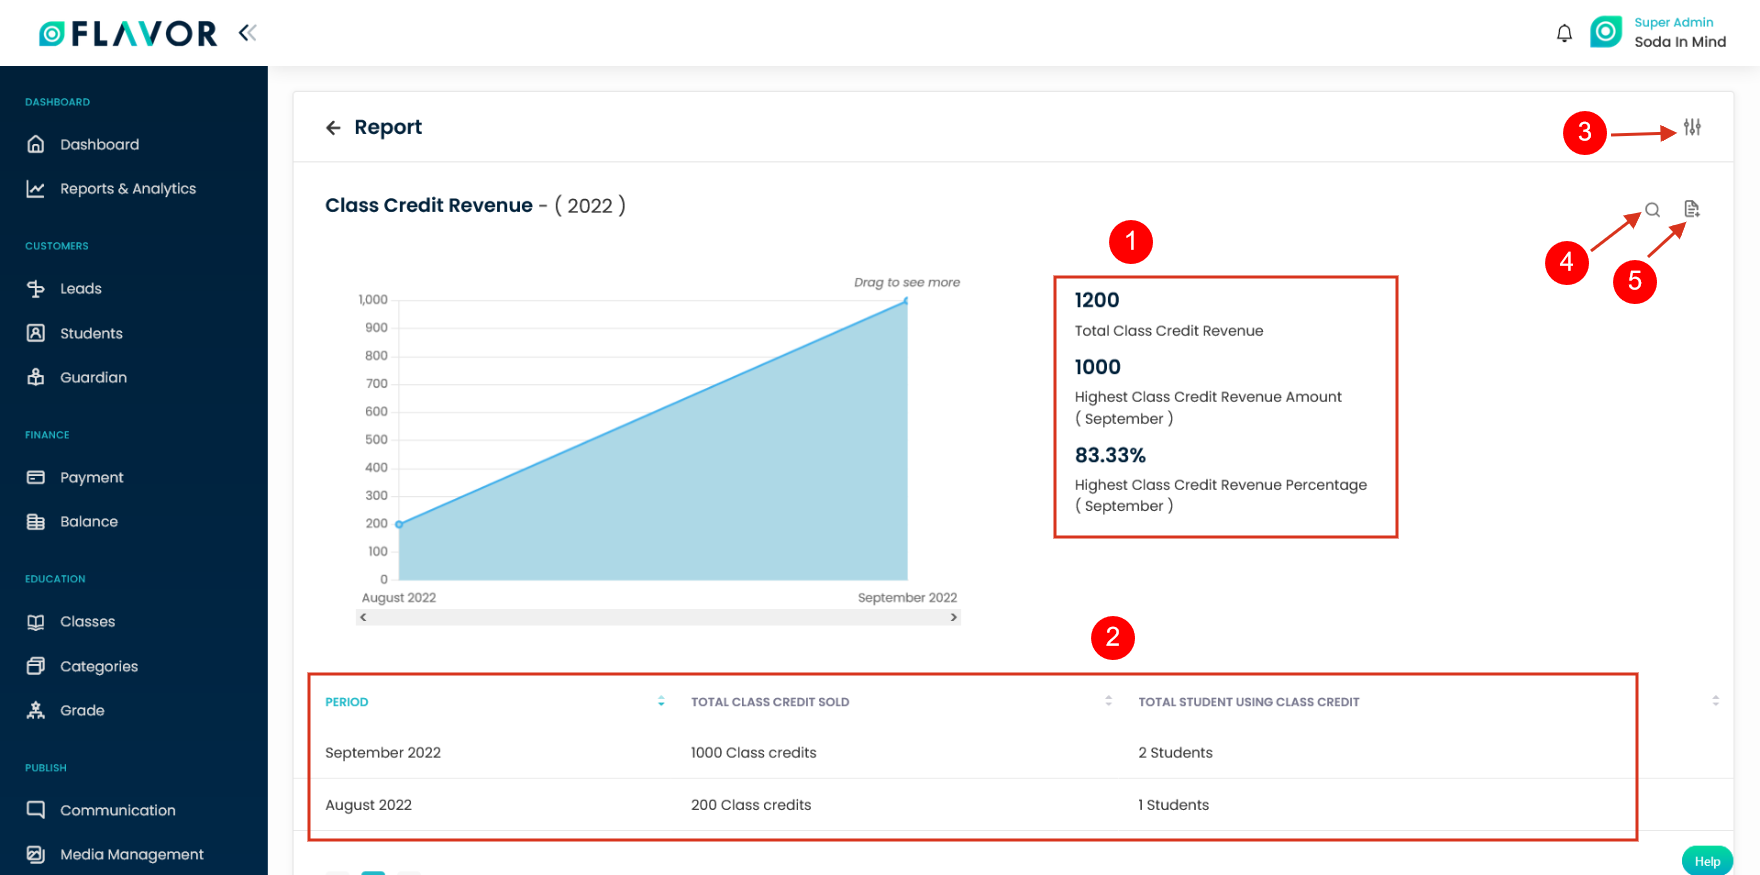
- Here the Total Class Credit Revenue Balance, Highest Class Credit Revenue Amount and month, and Highest Class Credit Revenue Percentage and month are shown.
- This part shows the Class Credit Revenue in tabular format. Period columns show you the month. Total Class Credit Sold shows the Class Credit amount that has been sold, Total wallet sold Invoices shows the wallet amount that has been sold, and Total Student using wallet shows the number of students who have adopted paying by wallet mechanism of Flavor System.
- Filter: It allows you to filter the records based on the Subsidiary, Branch, and Date span. Date span has two options viz. This Year and Custom Date.
- Search: You need to enter the period viz month or year and press enter. The searched results will be displayed in the table.
- Export: This option allows you to export the Class Credit Revenue report in excel or CSV format to the specified email id.
When clicking on each record in the table, a popup named Class Credit Revenue Details will appear on the screen.
Class Credit Revenue Detail popup will show you the Class Credit Revenue details for that particular month, viz. the list of students with their Date, Student Name, Class credit amount, , and Remarks.
The records can be searched and Class Credit Revenue exported too.
Refund Report
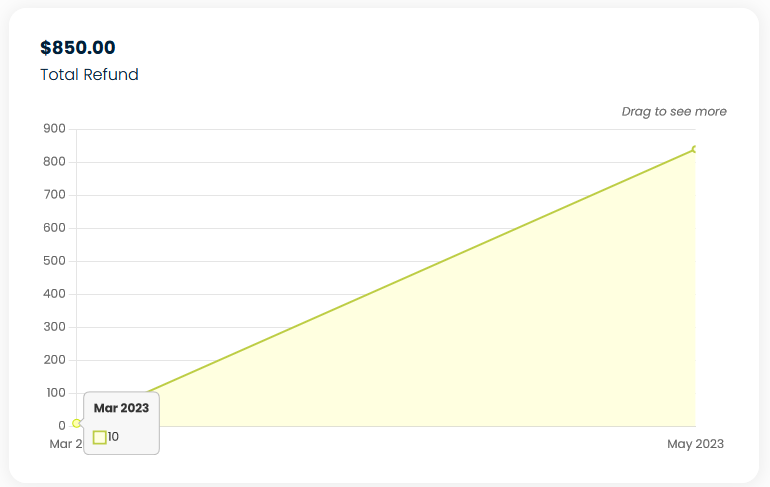
The Refund Box shows the Total Refund amount for the current year. The graph can be dragged to see through the other months.
- The Y-Axis shows the amount of data in SGD.
- The X-Axis shows the months.
- You need to hover over the graph to get the exact amount of refunds done in a month.
- When clicked on, you will be redirected to a detailed report.
Refund Report Details
When clicked on the graph, a new tab with Wallet Revenue Details reports details in tabular format will open.
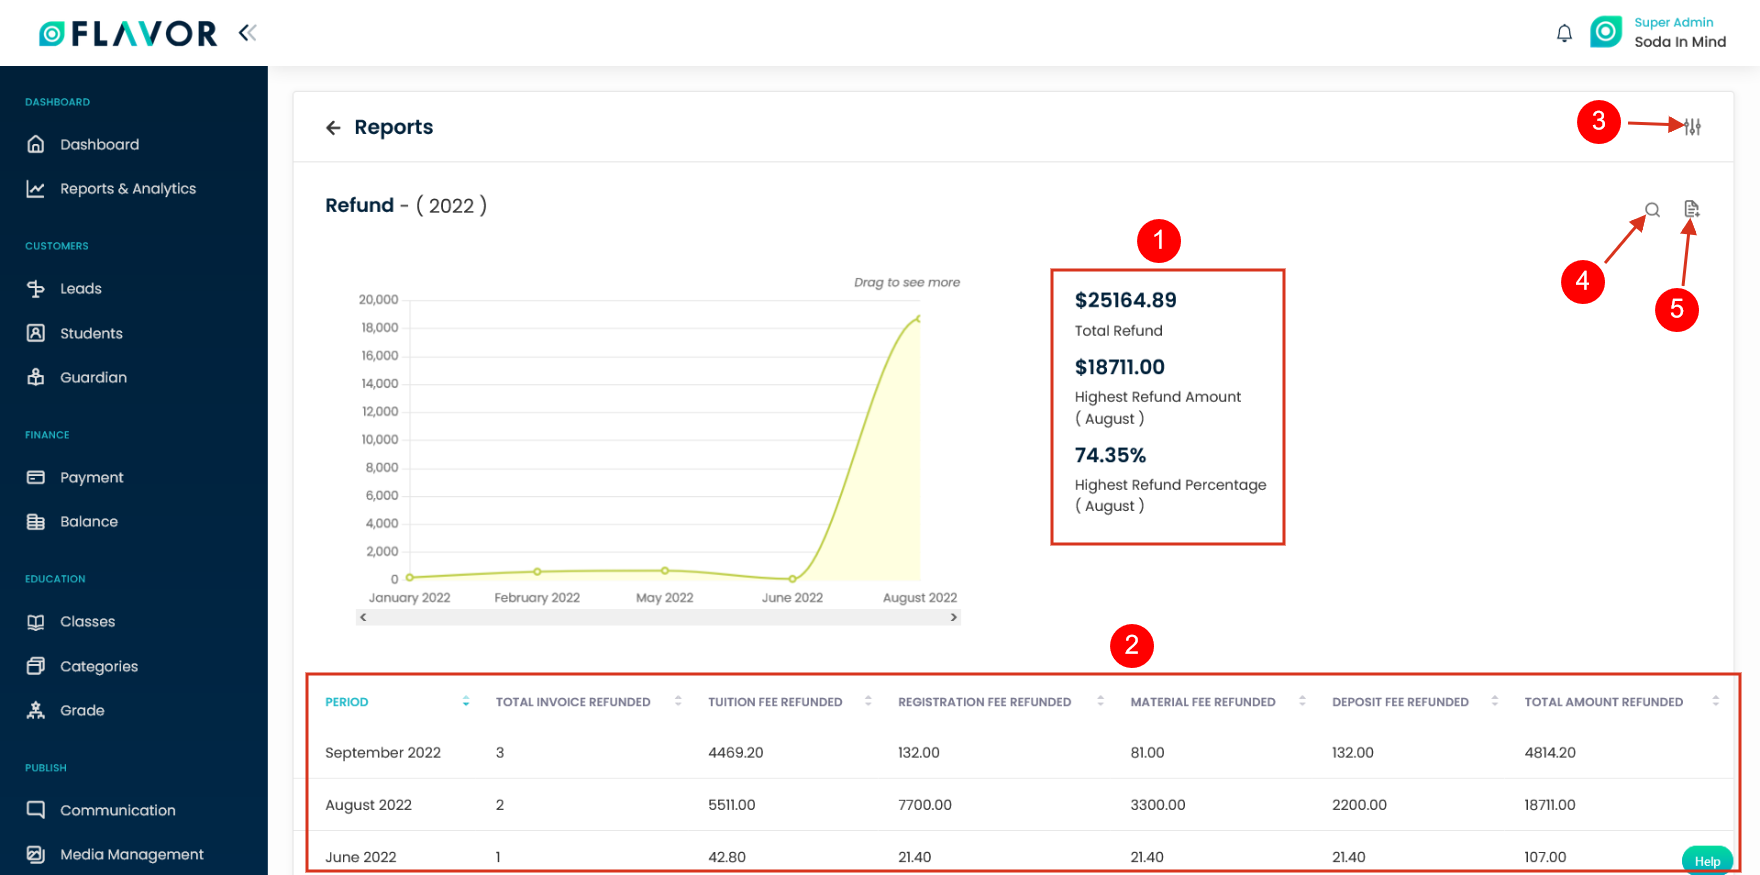
- Here the Total Refund, Highest Refund Amount and month, and Highest Refund Percentage and month are shown.
- This part shows the Refund in tabular format. Period columns show you the month. Total Invoice Refunded Shows the number of invoices that have been refunded, Tuition Fee Refunded shows the Tuition Fee amount that has been refunded, Registration Fee Refunded shows the amount of registration fee that has been refunded, Material Fee Refunded shows the amount of material fee that has been refunded, Deposit Fee Refunded shows the amount of deposit fee that has been refunded, Total Amount Refunded show the amount in totality that has been refunded within the period.
- Filter: It allows you to filter the records based on the Subsidiary, Branch, and Date span. Date span has two options viz. This Year and Custom Date.
- Search: You need to enter the period viz month or year and press enter. The searched results will be displayed in the table.
- Export: This option allows you to export the Refund report in excel or CSV format to the specified email id.
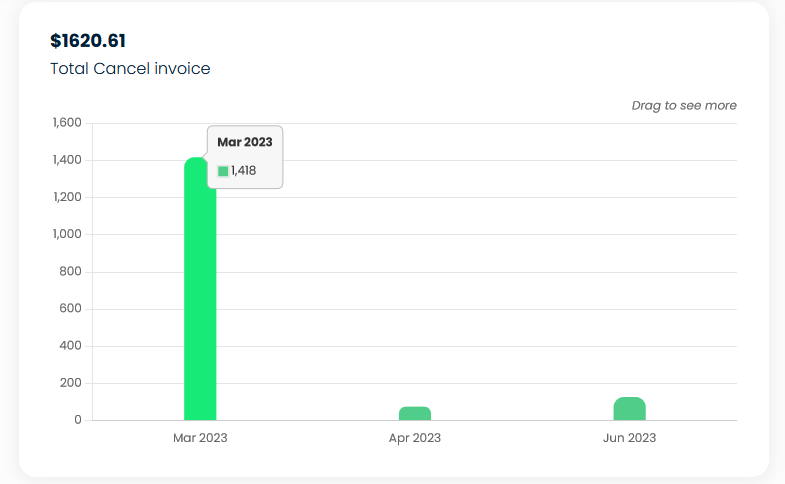
Cancel Invoice Report
The Cancel Invoice box shows the amount of invoice that has been canceled for the current year. The graph can be dragged to see through the other months.
- The Y-axis shows the value in the number of invoices.
- The X-axis shows the month name.
- You need to hover over the bar to get the exact amount of canceled invoices done in a month.
- When clicked on, you will be redirected to a detailed report.
Cancel Invoice Report Details
When clicked on the bar, a new tab with Cancel Invoice Report Details in tabular format will open.
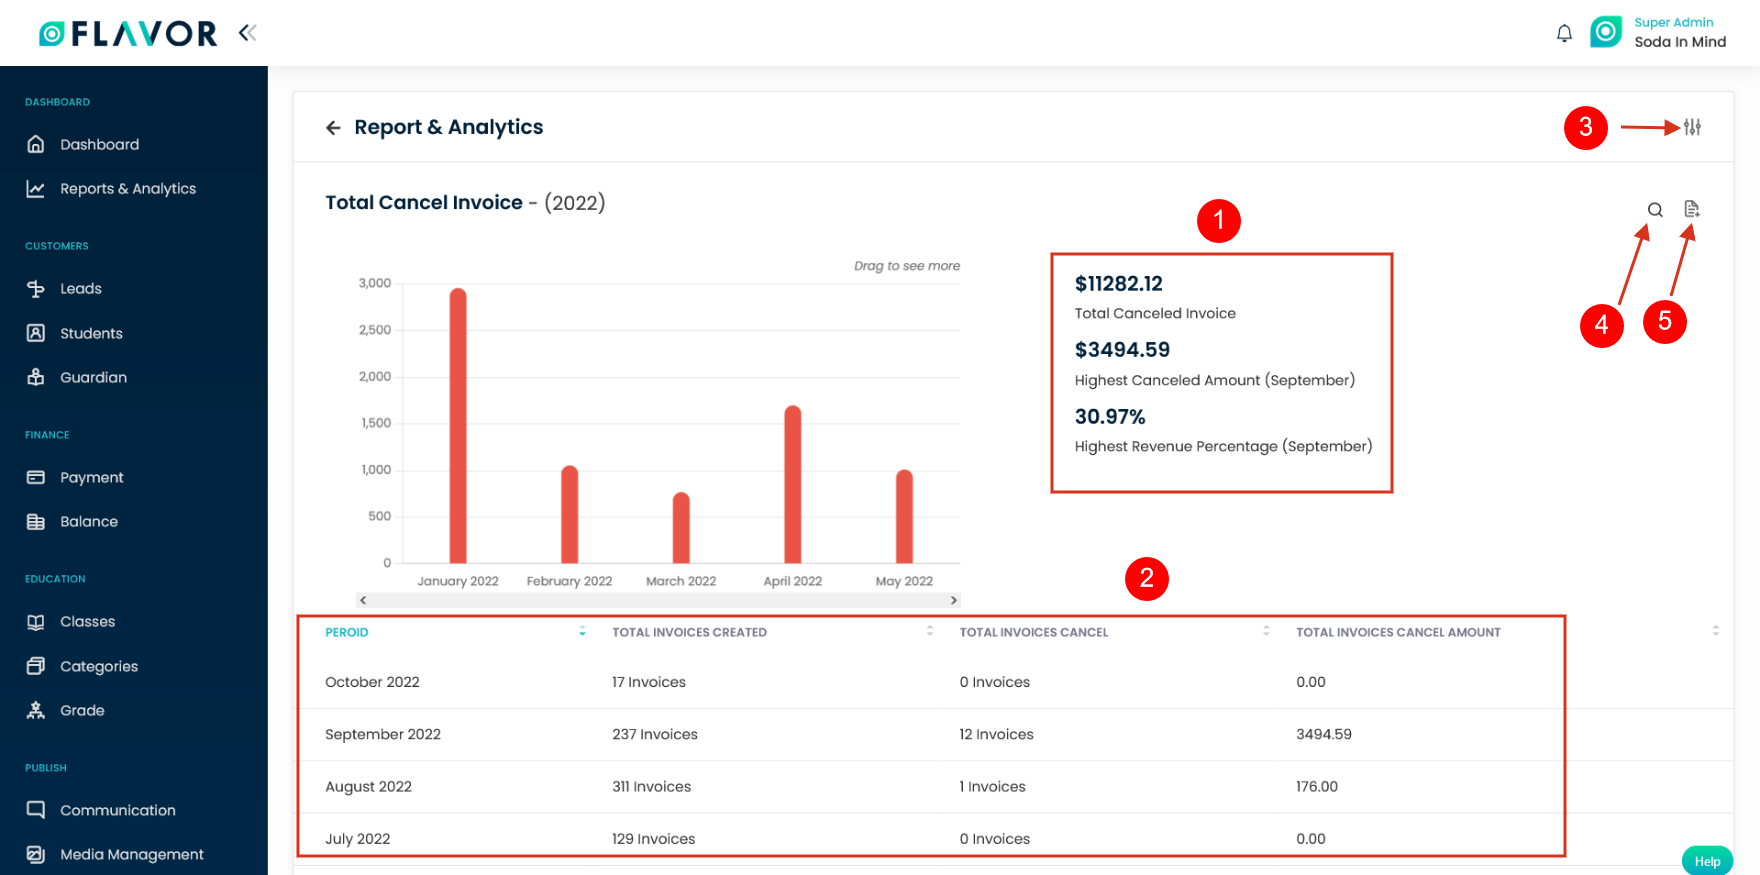
- Here the Total Canceled invoice, Highest Cancel Amount and month, and Highest Revenue Percentage and month are shown.
- This part shows the Cancel Invoice in tabular format. Period columns show you the month. Total Invoice Created shows the number of invoices created, Total Invoice Cancel shows how many Invoices were canceled, and Total Invoice Cancel Amount shows the amount of invoices that were canceled.
- Filter: It allows you to filter the records based on the Subsidiary, Branch, and Date span. Date span has two options viz. This Year and Custom Date.
- Search: You need to enter the period viz month or year and press enter. The searched results will be displayed in the table.
- Export: This option allows you to export the Canceled Invoice report in excel or CSV format to the specified email id.
Void Report
The Void Invoice box shows the amount of invoice that has been voided for the current year. The graph can be dragged to see through the other months.
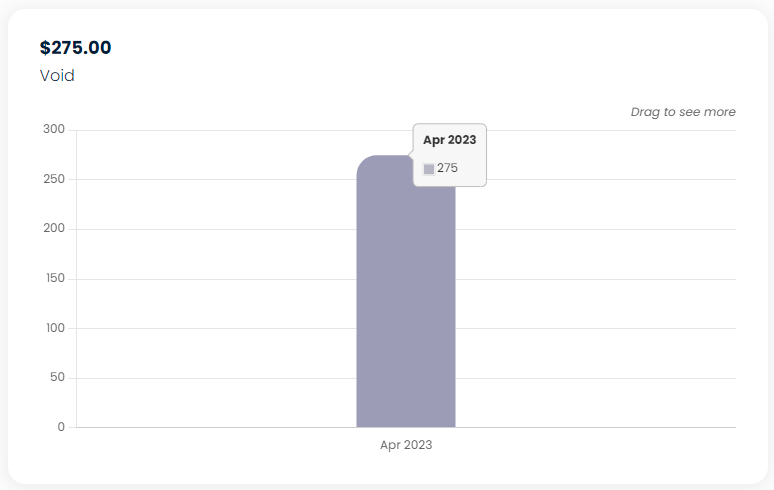
- The Y-Axis shows value in the amount in SGD.
- The X-Axis shows the month name.
- You need to hover over the bar to get the exact amount of voided invoices done in a month.
- When clicked on, you will be redirected to a detailed report.
Void Report Details
When clicked on the bar, a new tab with Void Report Details in tabular format will open.

- Here the Total Voided Amount, Highest Voided Amount and month, and Highest Voided Percentage and month are shown.
- This part shows the Voided Invoice in tabular format. Period columns show you the month. Total Invoice Created shows the number of invoices created, Total Invoice Void shows how many Invoices were Voided, and Total Invoice Void Amount shows the amount of invoices that were Voided.
- Filter: It allows you to filter the records based on the Subsidiary, Branch, and Date span. Date span has two options viz. This Year and Custom Date.
- Search: You need to enter the period viz month or year and press enter. The searched results will be displayed in the table.
- Export: This option allows you to export the Canceled Invoice report in excel or CSV format to the specified email id.
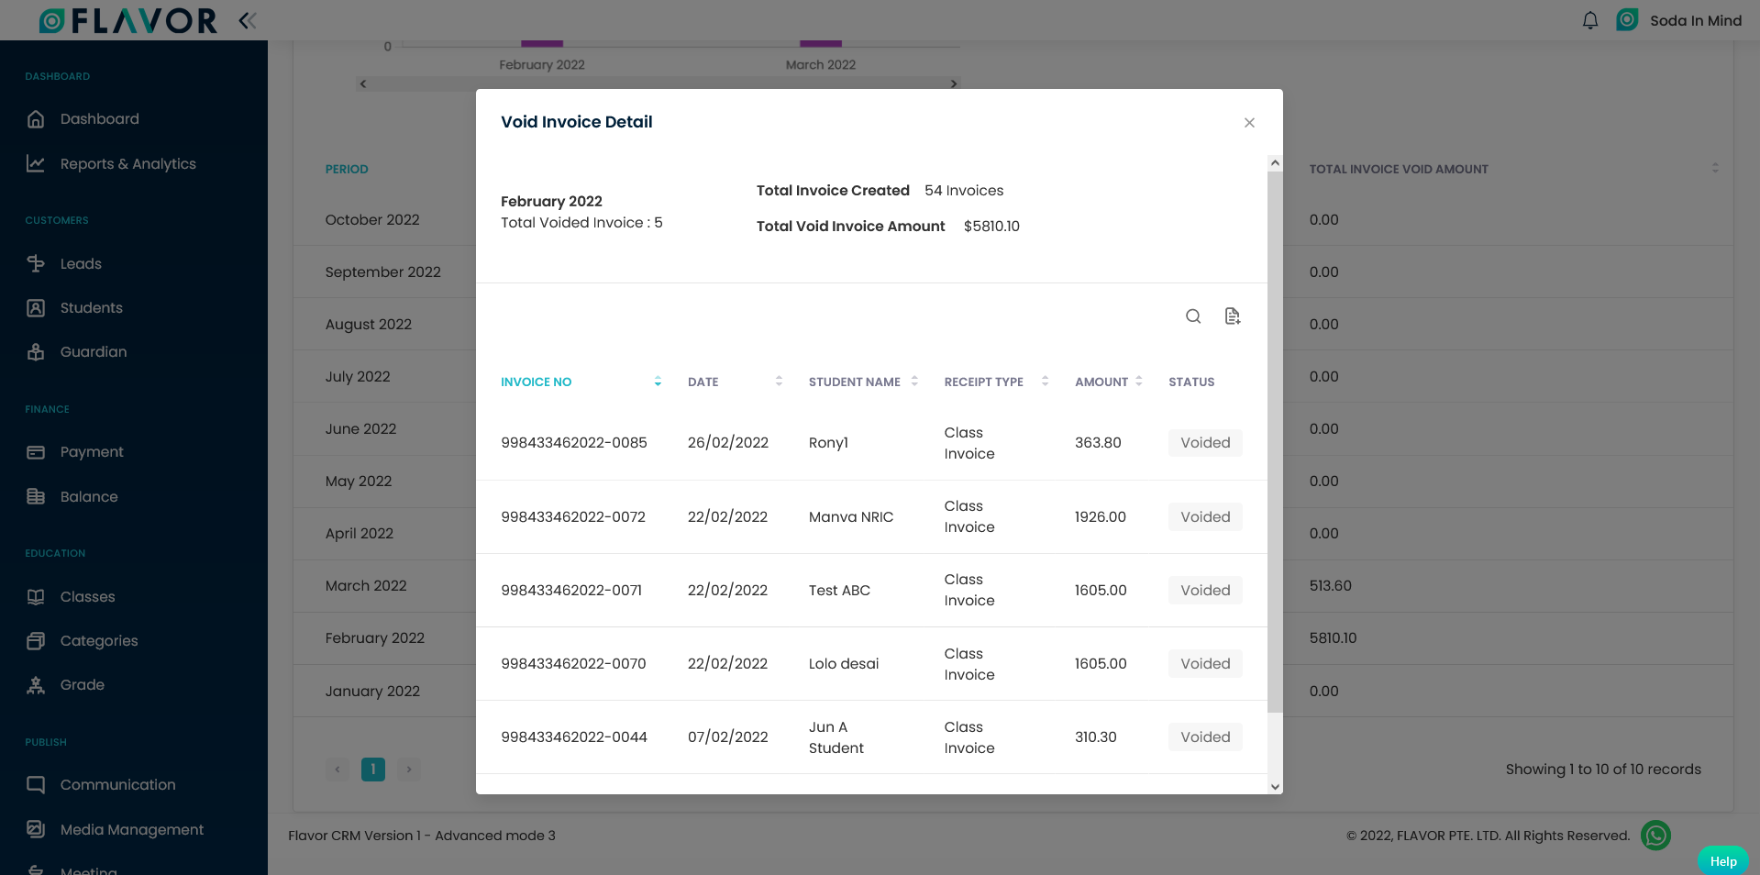
When clicking on each record in the table, a popup named Void Invoice Details will appear on the screen.
Void Invoice Details Detail popup will show you the Void Invoice Details details for that particular month, viz. the list of students with their invoice number, Date, Student Name, Receipt Type, Amount, and Status.
The records can be searched and Void invoice detail can be exported too.
Sales Report
This Box shows the Total Sale Amount(Total revenue + Total outstanding) Report for the current year. The graph can be dragged to see through the other months.
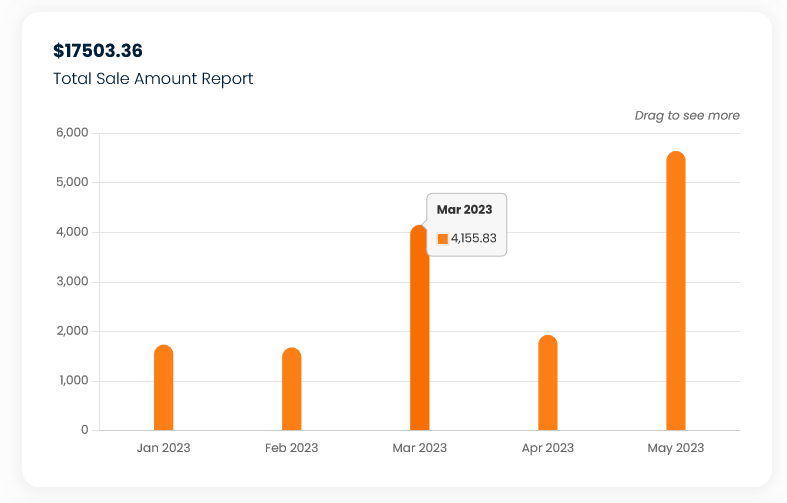
- The Y-Axis is for Revenue in SGD.
- The X-Axis is for months.
- When Hovered on a bar stick you get to exact Sales Amount.
- When clicked on, you will be redirected to the detailed report of that month’s performance.
Sales Amount Report Details
When clicked on the bar, a new tab with Sales Amount Report Details in tabular format will open.
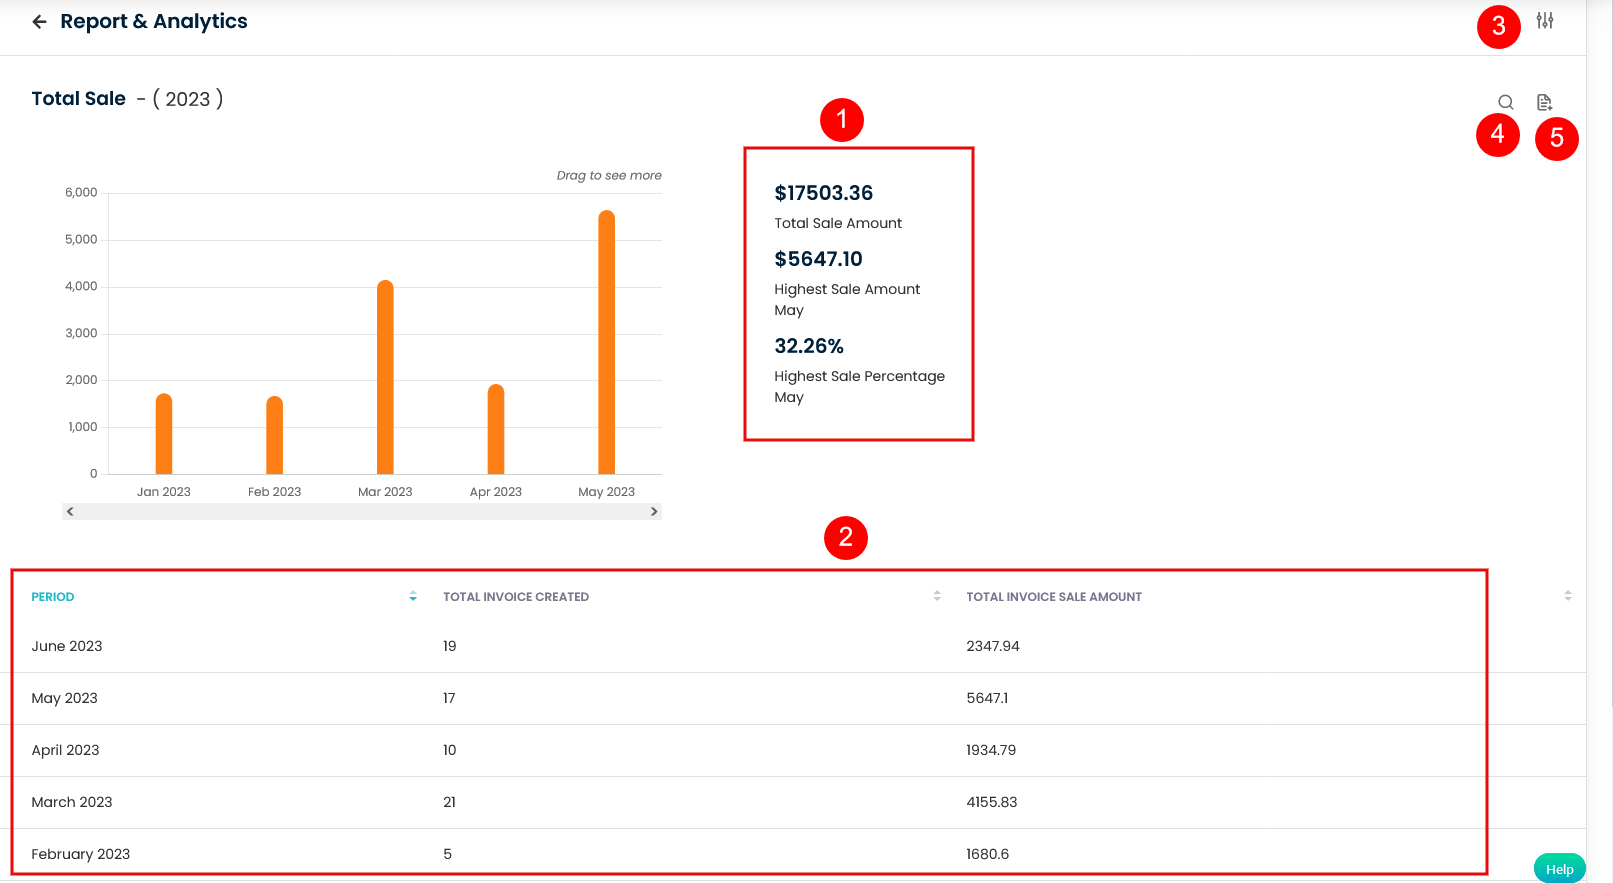
- Here the Total Sales Amount, Highest Sales Amount and month, and Highest Sales Percentage are shown.
- This part shows the Sales Amount in the tabular format. Period columns show you the month. Total Invoices created shows the number of Invoice created. Total Invoice Sale Amount shows you the total sales amount for that month.
- Filter: It allows you to filter the records based on the Subsidiary, Branch, and Date span. Date span has two options viz. This Year and Custom Date.
- Search: You need to enter the period viz month or year and press enter. The searched results will be displayed in the table.
- Export: This option allows you to export the Sales Amount report in excel or CSV format to the specified email id.
Need more help? Ask us a question
Please let us know more of your details and our team will reach out to you very shortly.